new
improved
Cloud Cost Management (FinOps)
Dashboard - Drill-Through Feature in Charts
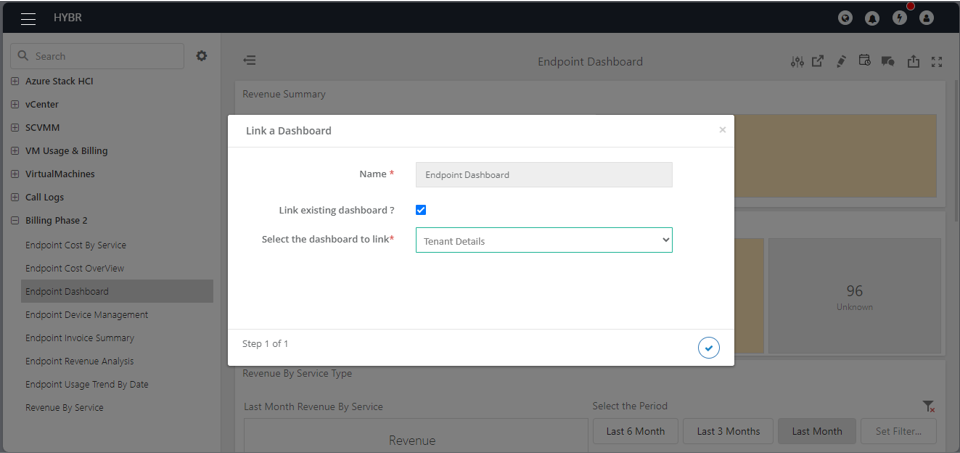
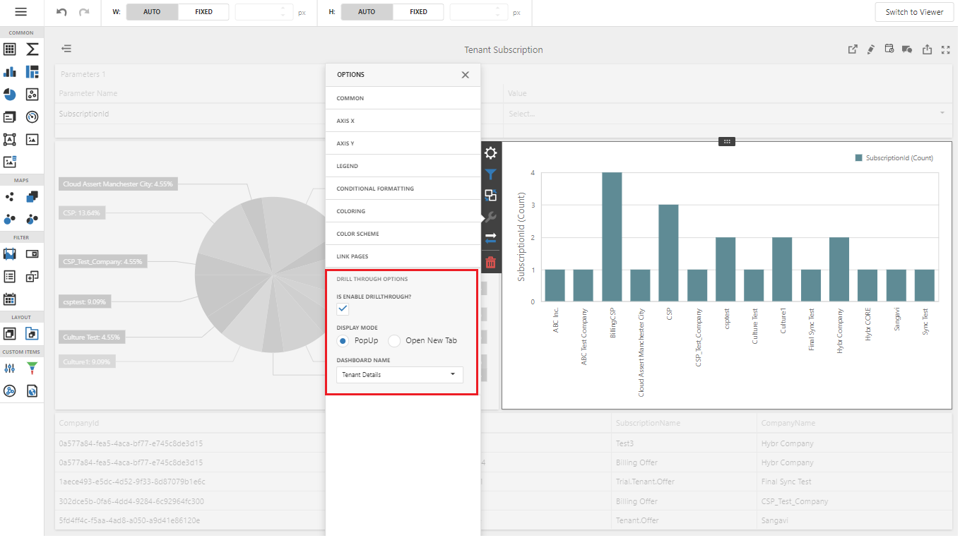
Our dashboards have been enhanced with a new feature: drill-through options in pie charts and bar charts. This functionality allows users to dive deeper into their data by clicking on any element in a chart.
Users can now interact with chart elements to view more detailed information about the selected data points. This feature provides a seamless way for users to gain more insights by exploring the specifics behind aggregated data.
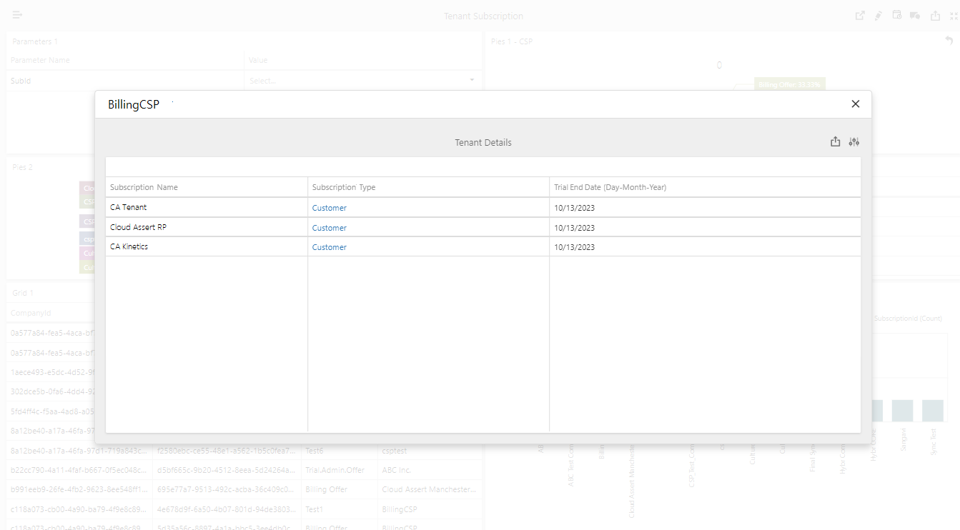
Upon clicking an item in the chart, the detailed data can be displayed in two ways:
Pop-Up Window:
A convenient pop-up window appears within the same tab, overlaying the current dashboard to provide additional details without navigating away.New Tab:
Alternatively, users can choose to open the detailed view in a new browser tab, allowing them to compare the detailed data alongside their dashboard.This new drill-through capability significantly enhances the interactivity and usability of our dashboards, empowering users to uncover deeper insights with ease.


